





.jpg)
TL;DR
- Judge a provider on your own traffic, not on their chart. Seven days and one script are enough.
- Three numbers decide it: time until a transaction is usable in your process, time from submission to confirmed landing, and the share that never arrives.
- Ping and the average latency on a landing page answer none of the three.
- Read p99 and p99.9. Throw the mean away.
- Measure from two places before blaming anyone: your production host and a machine beside the provider's datacenter.
- A provider that fails the protocol on its own numbers will not improve after a plan upgrade.
A trial looks fine. The dashboard shows a clean average, the endpoint answers in a few milliseconds, and the bot still loses trades in production. The usual cause is not a bad provider. It is an evaluation built on someone else's chart instead of your own load.
This article is a seven-day protocol for measuring the provider you already have, or the one you are trialling, and ending the week with a yes or no based on numbers. It is not a comparison of vendors. If you need the basics of what a node does and how self-hosting compares, start with our Solana RPC node full guide.
One disclosure before anything else. We sell RPC. The protocol is written so it works against any provider, us included, and the five questions at the end are ones you should send to us as well.
1. What you measure, and what you do not
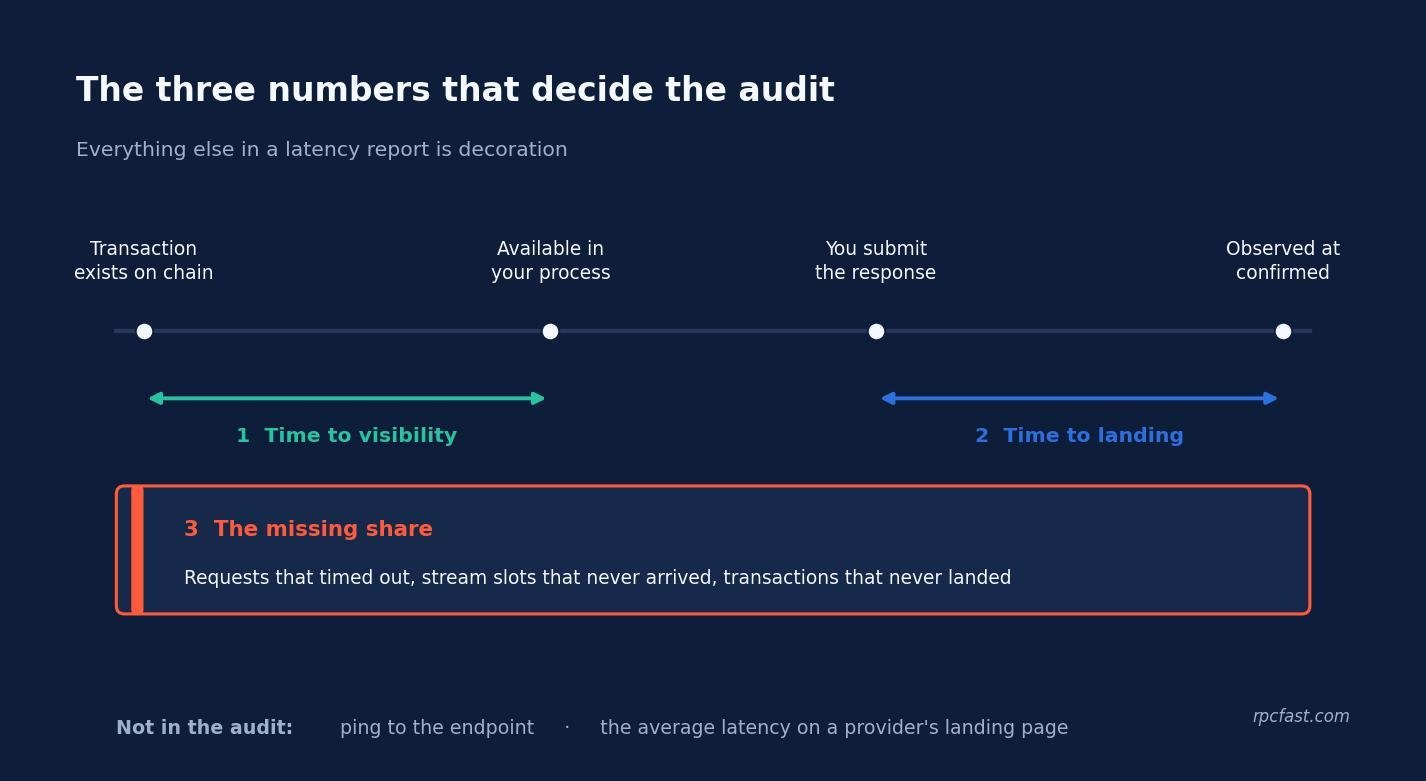
Three quantities decide whether a provider is good enough for a trading workload. Everything else in a latency report is decoration.
- Time to visibility. From the moment a transaction exists on chain to the moment it is available inside your process, decoded and usable.
- Time to landing. From the moment you submit a signed transaction to the moment you observe it at confirmed commitment.
- The missing share. Requests that timed out, stream slots that never arrived, transactions that never landed.
"Confirmed" needs to be pinned down, because it is where most landing claims quietly drift. Solana has three commitment levels, and processed, confirmed and finalized produce three different landing numbers for the same transactions. This protocol counts at confirmed, and so should any figure a provider quotes you.
Two popular numbers are not on the list. A ping measures ICMP to a load balancer, not a Solana response, and many networks deprioritise ICMP anyway. The average latency on a provider's landing page was measured from their host, with their client, on their workload. It tells you nothing about yours.
One caveat on time to visibility. Absolute one-way latency between two machines needs synchronised clocks, and most teams do not have them at the precision this requires. So measure it the way it can be measured honestly: request round-trip time on one monotonic clock, and relative arrival order between two sources inside the same process. If feed B keeps beating feed A in your own process, that is a fact you can act on without trusting anyone's clock.
If your current tooling cannot produce all three numbers, you are not ready for day two. Fix the instrumentation first.
2. Build a 48-hour baseline
One process, one clock, every event written down.
Run the collector as a single process on the host your strategy actually runs on. Time every duration with a monotonic clock, never wall time. NTP moves wall time forwards and backwards, and it will invent latency spikes that never happened, or hide real ones.
Write one line per event. This is enough:
{
  "ts_send_ns": 1726480512004311000,
  "ts_recv_ns": 1726480512023907000,
  "method": "getAccountInfo",
  "slot": 312904117,
  "resp_bytes": 1840,
  "status": "ok",
  "source": "provider-a"
}- Method. Providers are fast on some calls and slow on others. A single blended number hides which is which.
- Response size. A heavy payload takes longer to deliver. Without size, a slow provider hides behind an expensive call.
- Slot. It lines your events up against the chain rather than against your own clock, and exposes stream gaps.
- Send and receive timestamps. Both from the same monotonic source, in nanoseconds. You compute latency later, not at write time.
- Status. Timeouts and errors are data. Dropping them from the log removes the third number entirely.
Two mistakes that invalidate a baseline
Coordinated omission. If your load generator waits for each response before sending the next request, slow responses lower your sending rate, and the worst moments never get sampled. Send on a fixed schedule, whatever happens to the previous request. It is one of the most common reasons a measured p99 looks far better than the one production actually sees.
A flattering window. Forty-eight hours covers two full daily cycles, including the hours your markets are busiest. A few hours on a quiet Sunday produces numbers that describe a network nobody trades on.
Less than 48 hours of continuous data is an impression, not an audit. Any hour in which your own collector had a gap longer than 60 seconds does not count toward the 48.
3. Read p99 and p99.9. Throw the mean away.
Here is why, on one example. Take 1,000 requests. 985 answer in 20 ms. 15 answer in 900 ms.
- The mean is 33 ms. It looks healthy.
- The median, p50, is 20 ms. It looks excellent.
- The p99 is 900 ms. That is the number that loses the trade.
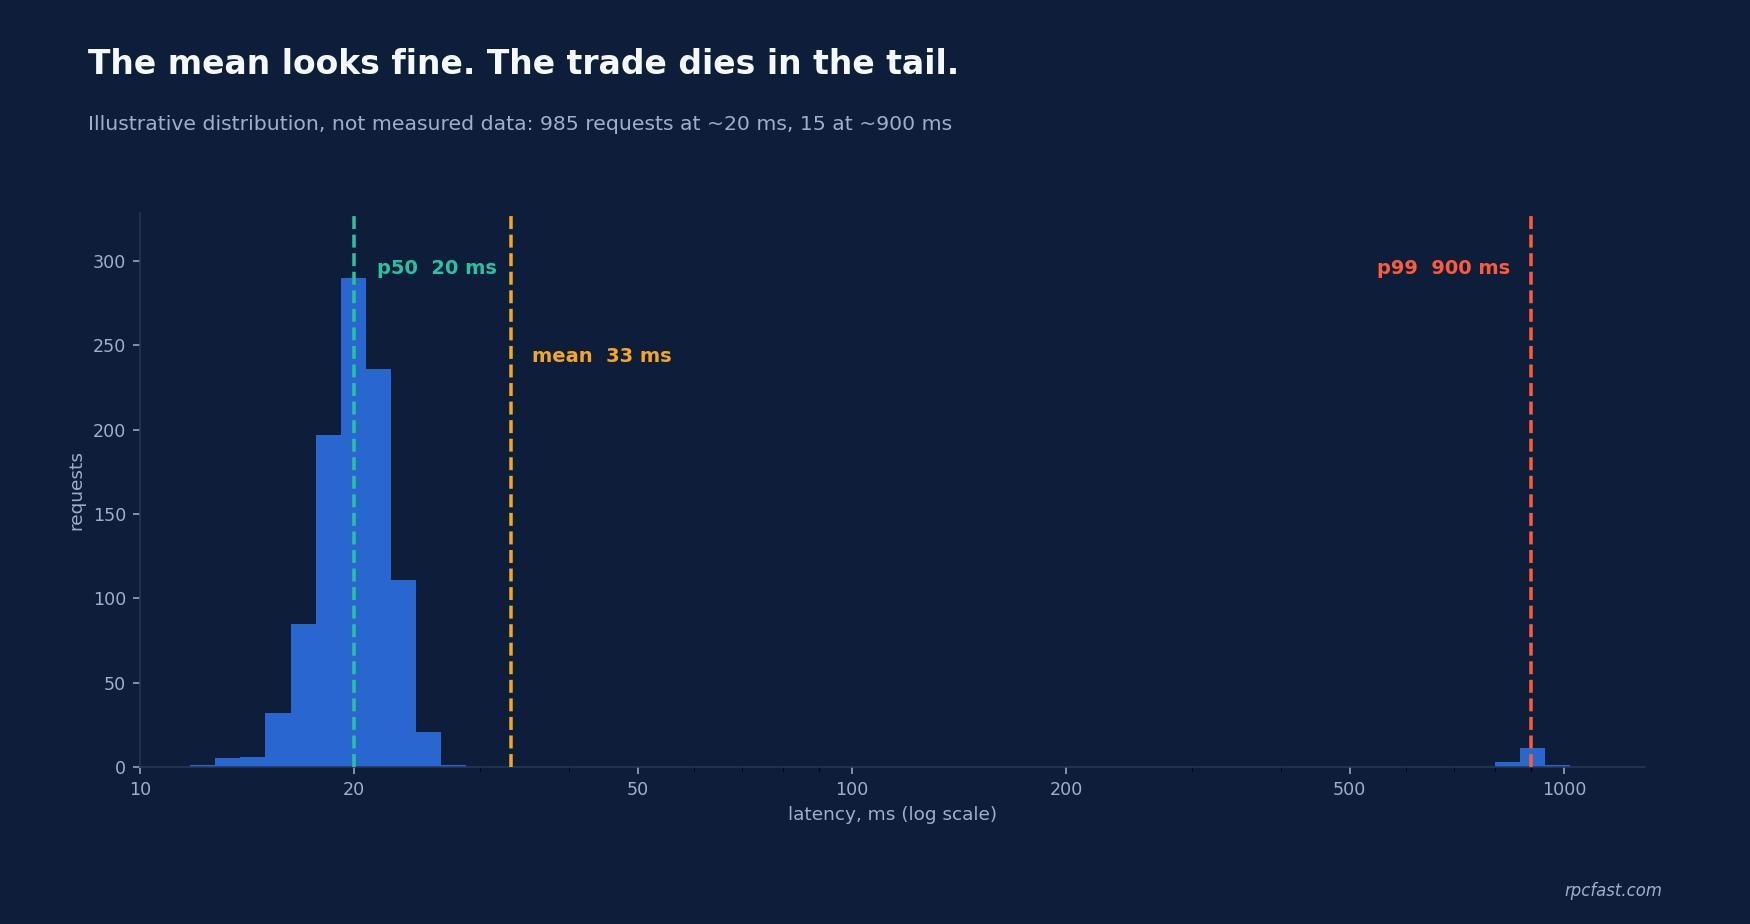
At 10 requests per second, 15 slow ones per thousand means nine slow responses every minute. And they are not randomly spread. A strategy fires at the moment of opportunity, which is when the network is busiest, which is precisely when the tail lives. The slow requests cluster around the trades you most wanted.
p99.9 needs volume to mean anything. With 10,000 samples it rests on the ten slowest observations. With 1,000 samples it rests on one, which is an anecdote with a decimal point. Compute percentiles per method, from the raw log:
import json, numpy as np

rows = [json.loads(l) for l in open("audit.log")]
lat = [(r["ts_recv_ns"] - r["ts_send_ns"]) / 1e6
       for r in rows if r["method"] == "getAccountInfo" and r["status"] == "ok"]

p50, p99, p999 = np.percentile(lat, [50, 99, 99.9])
print(f"n={len(lat)}  p50={p50:.1f}  p99={p99:.1f}  "
      f"p99.9={p999:.1f}  ratio={p99 / p50:.1f}")
Note what the snippet filters out: failed requests. That is deliberate for the percentile, and it is why the missing share is measured separately. A provider that times out on its slowest calls will look faster in its percentiles, not slower.
Compute p99 divided by p50 for each method. A ratio of 3 or more means the tail belongs to the provider or to the network in front of it, and you go to block 4 to find out which. Never report p99.9 from fewer than 10,000 samples.
4. Separate the provider from your own network
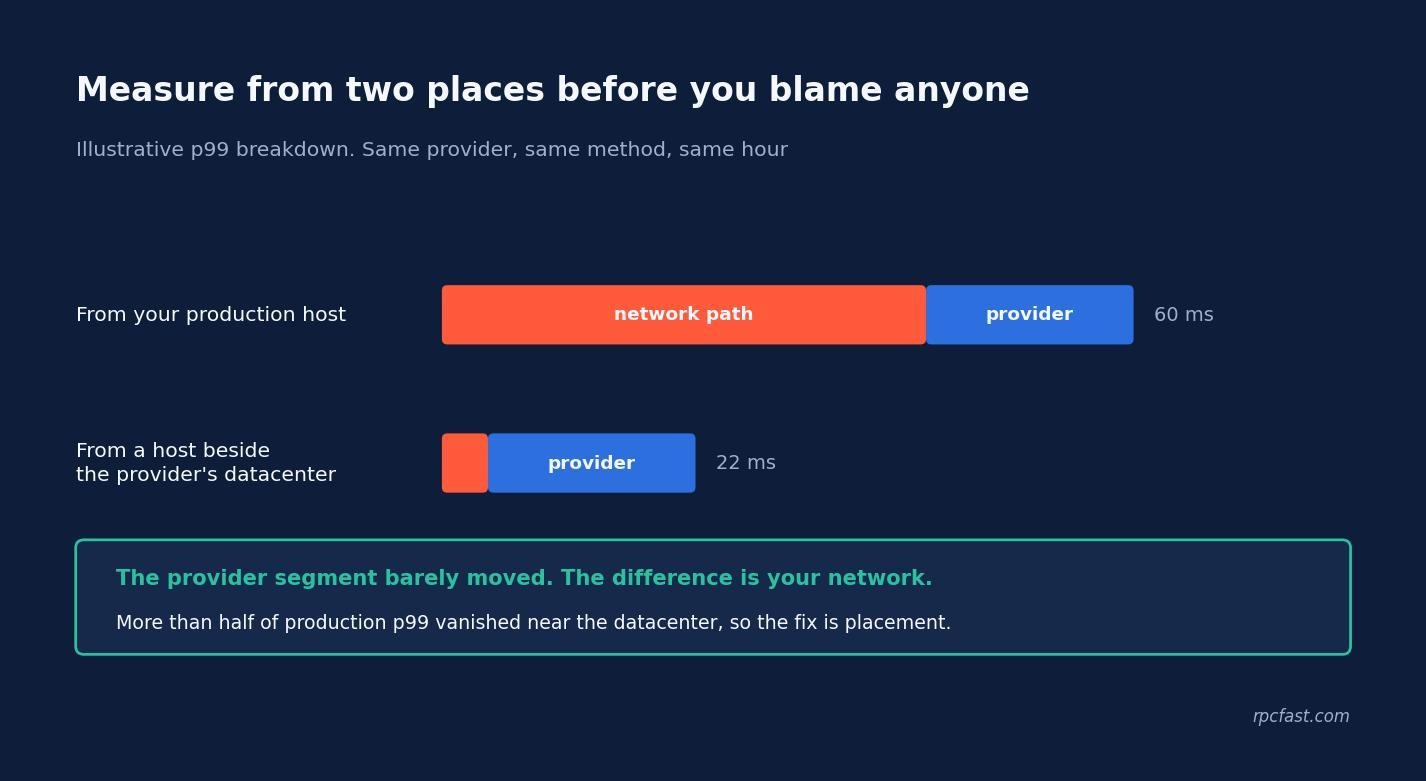
Same measurement, two vantage points. Run the collector on your production host and, at the same time, on a machine in the same region as the provider's datacenter, ideally in the same facility. Same methods, same schedule, same hour.
Reading the result is simple:
- Near-datacenter numbers tight, production numbers spread out. The tail lives in the path between you and the provider: your cloud region, your egress, a congested hop, a route that crosses an ocean.
- Both spread out the same way. The provider owns the tail. Take that to block 6.
- Both tight, strategy still slow. The bottleneck is inside your own process. Neither the provider nor the network is your problem.
Check TCP retransmissions on the production host while you measure. On Linux, ss -ti shows retransmit counters per connection. Packet loss surfaces as tail latency, not as errors, so it is easy to misread as a slow provider.
This block is where teams discover they spent a month tuning the wrong thing. When the gap is network, no provider switch will close it. The fix is placement: running the strategy next to the node rather than across a region, which is what our Solana trading node setup is built around.
If more than half of your production p99 disappears when you measure from beside the provider's datacenter, the fix is network placement, not a different provider.
5. Test under load and during a storm
Calm-hour numbers describe a network nobody trades on. Repeat the whole measurement during a congested window: a popular token launch, a sharp market move, or simply the busiest hours your own logs already show. Then watch three things.
Rate limits
Log every HTTP 429 with its timestamp and your actual request rate at that second. A 429 while you are above your contracted rate is your problem. A 429 while you are inside it is the provider's, and it goes straight into the report. Note whether the limit is enforced per second or per window, because a per-window limit lets you burst and then locks you out for the rest of the window, which looks exactly like an outage.
Landing share
Count signed, submitted transactions that reach confirmed, against all you submitted. Keep expired blockhashes separate from rejections: an expired blockhash usually means your transaction waited too long somewhere, while a rejection is usually about the transaction itself. Mixing them hides where the time went.
Stream recovery
Kill the stream connection on purpose, reconnect, and record two things: the time until the first new message, and whether the slots in between arrive. A gap you have to backfill yourself is data the provider did not deliver, and it belongs in the missing share.
Use our published figures as a reference line, not a pass mark. Through Beam, transactions landed in 330 ms on average against 457 ms on a standard endpoint, over 20 runs. Custom bots on dedicated, validator-adjacent infrastructure clear 85% landing on competitive launches, against 35 to 68% for off-the-shelf setups. If your congested-window landing share sits in that 35 to 68% band, the delivery path is the constraint, whatever your read latency says. Any 429 inside your contracted rate, and any slot gap the provider did not recover, is a finding for block 6.
6. Questions to ask the provider, and when to leave
By day six you have your own numbers. Now ask the provider to explain theirs, in writing. A verbal answer on a call is not an answer.
- What client configuration produced the latency figures you publish: client library, connection reuse, region, and subscription filters?
- Can you send p50, p99 and p99.9 for the methods I use, over the last 30 days, with the sample size for each?
- In which facility and datacenter does my endpoint run?
- Is your rate limit enforced per second or per window, per key or per IP, and what exactly happens when I burst?
- What do you count as "landed": processed, confirmed or finalized, and measured from which timestamp?
Our benchmarks page is one example of the kind of numbers a vendor can publish, with the method and sample size alongside. We do not publish every row of the table above there either. Ask us for the missing ones in writing, the same way you would ask anyone else.
When to leave
Three conditions come from the provider's answers, two from your own data:
- The provider will not give you percentiles.
- The provider will not name the datacenter your endpoint runs in.
- The provider cannot reproduce its own published benchmark when you run it with the configuration it stated.
- Your p99 to p50 ratio stays at 3 or more when measured from beside their datacenter, so the tail is theirs.
- Your congested-window landing share sits in the 35 to 68% band.
Two or more conditions true: switch. One: escalate in writing and rerun days three to five. None: stay. The provider is fine, and your bottleneck is somewhere else.
The seven-day checklist
Paste this into a ticket. One line per day.
Audit plan
- Day 1: Instrument. One process on the production host, monotonic clock, one JSON line per event, fixed send schedule. Start collecting.
- Day 2: Let the baseline run. Check your own collector for gaps over 60 seconds and discard those hours.
- Day 3: Compute p50, p99 and p99.9 per method. Flag every method with a p99 to p50 ratio of 3 or more.
- Day 4: Run the same collector beside the provider's datacenter. Split the tail into network and provider.
- Day 5: Measure during a congested window. Count 429s, landing share and unrecovered stream gaps.
- Day 6: Send the five questions. Compare the written answers with your own numbers.
- Day 7: Count the exit conditions and decide: switch, escalate, or stay.
The audit takes a week and one script
By day seven you have three numbers measured on your own traffic, a clear answer on whether the tail belongs to the provider or to your network, and written replies to five questions. That is enough to decide.
A provider that cannot pass this protocol on its own numbers will not get better after a plan upgrade. A provider that passes it has earned the renewal. Either way, the decision rests on evidence you collected, rather than on a chart someone drew for you.
.jpg)


.jpg)


