





.jpg)
TL;DR
→ Three providers show 95%, 98% and 99%—and none of them is comparable. No one publishes the commitment level, the fee, the window, or the sample. A rate without a method is a marketing asset, not a measurement.
→ "Landed" is three different moments. Accepted (~0.4s), confirmed (~1–2s), finalized (~13s). Roughly 5% of blocks never finalize, so an accepted-based number is inflated before the test starts.
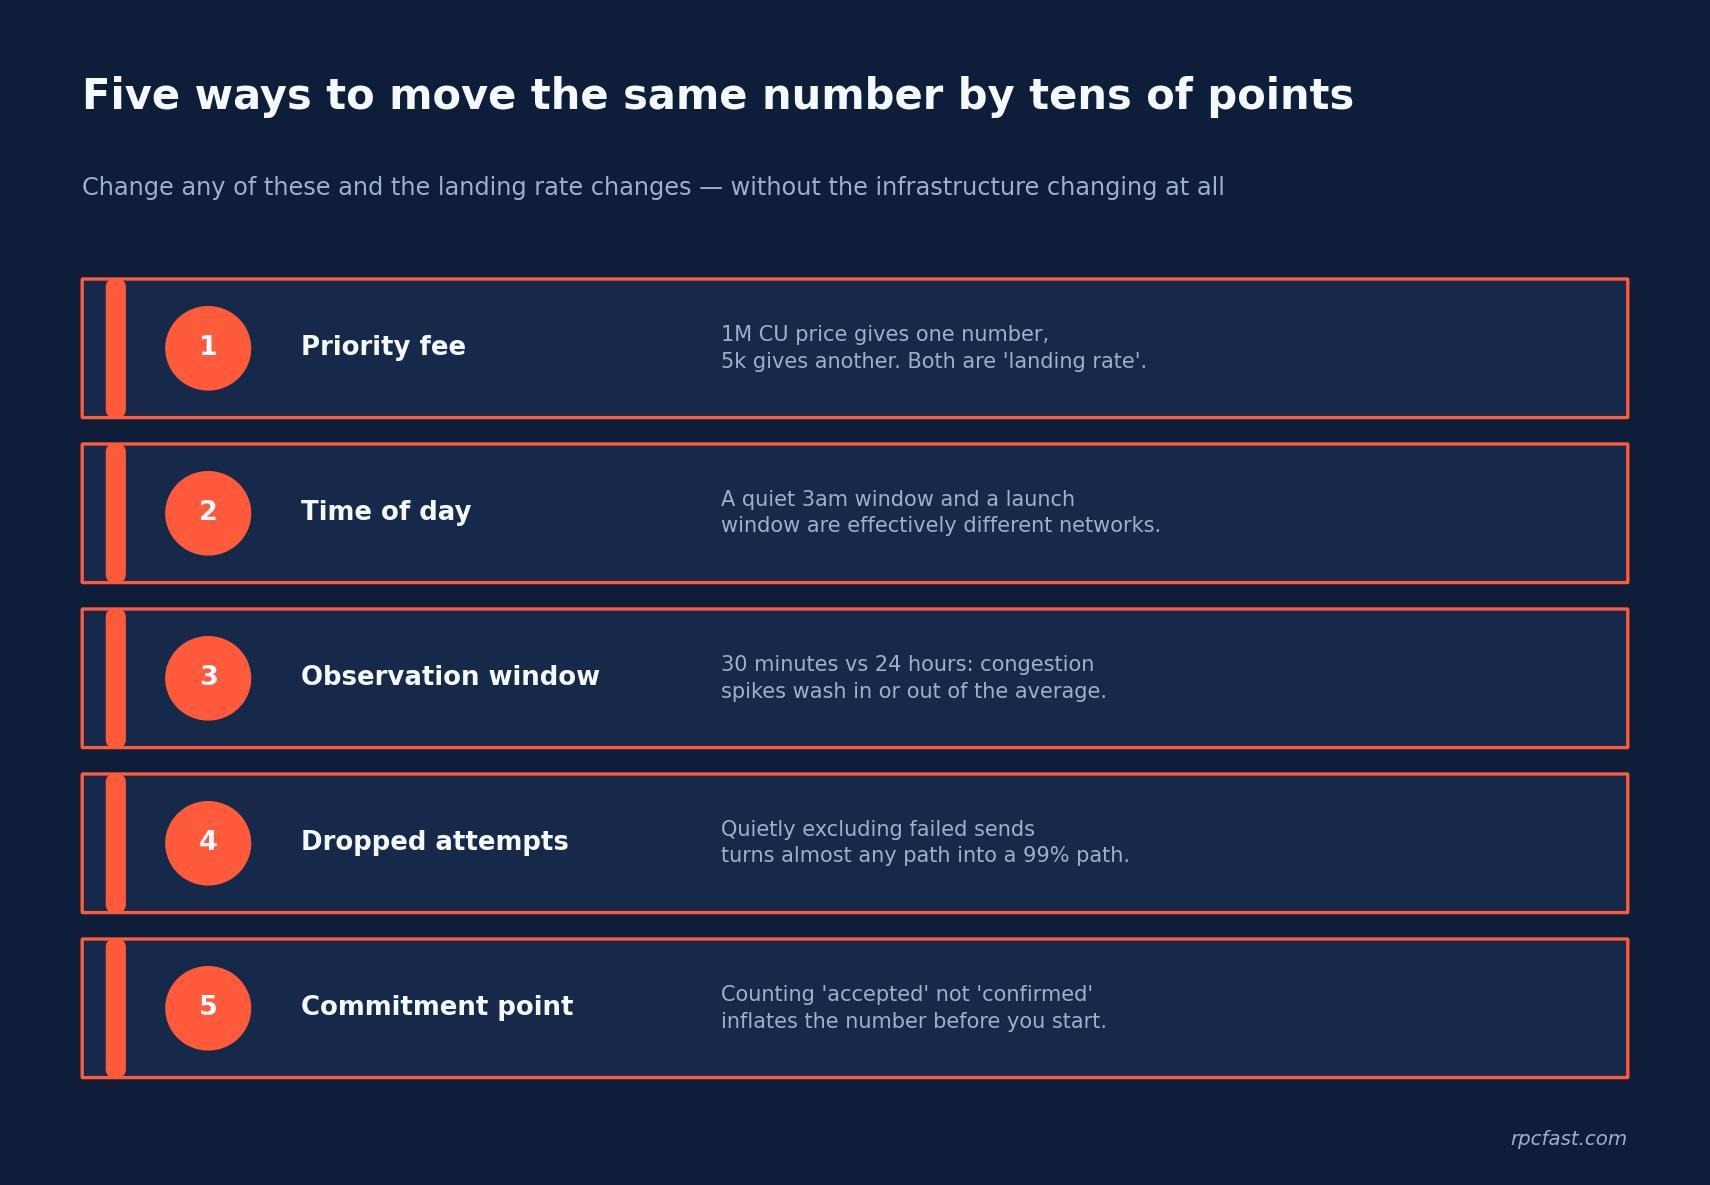
→ Five variables move the same number by tens of points: priority fee, time of day, observation window, dropped attempts, and commitment point. Change any one and the infrastructure looks better or worse without changing at all.
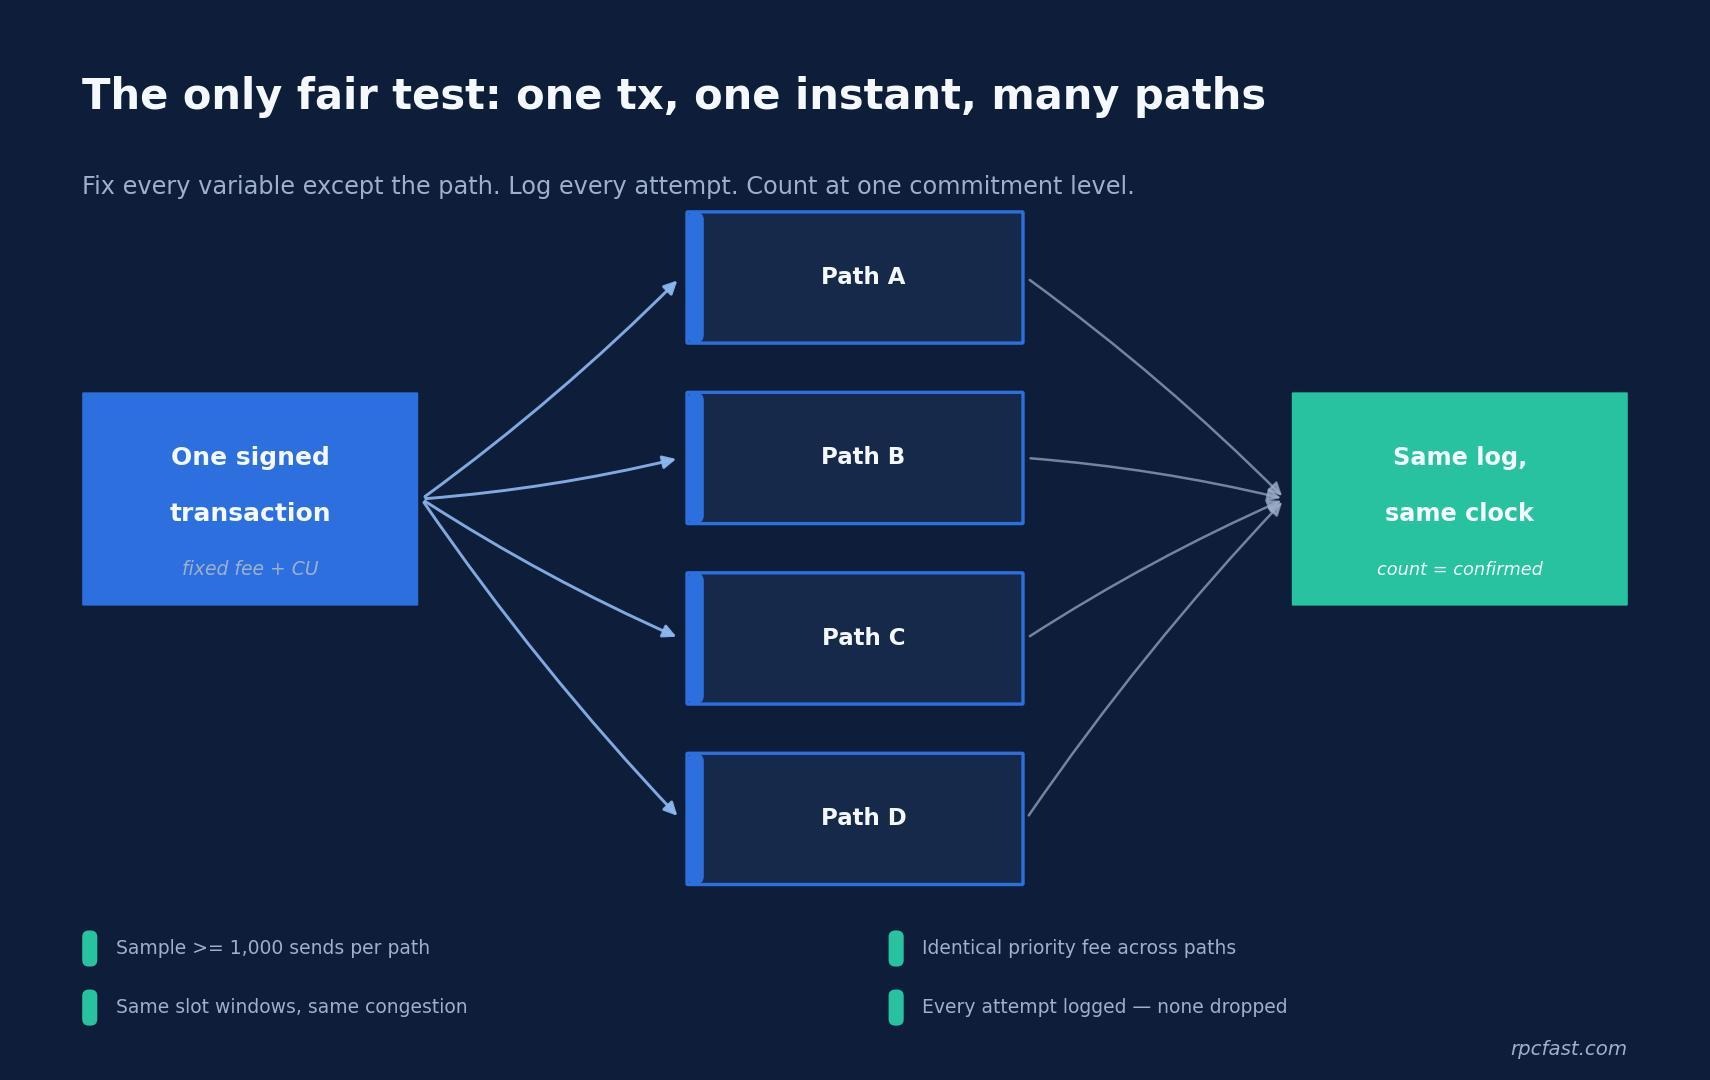
→ The only fair test is parallel: one transaction shape, one instant, every path at once, at least 1,000 sends each, every attempt logged, counted at confirmed.
→ Then our numbers—including the matchup we win only three times out of four, and the places where our own published figures do not yet meet the bar this article sets.
→ This is not a guide to improving landing rate. That is covered separately; here we only cover what to measure, how, and what corrupts everyone else's figures.
If you have ever compared two Solana infrastructure providers by their advertised landing rate, you have compared nothing. One measured at accepted during a quiet Tuesday with a 1M compute-unit price. The other measured at finalized across a launch window, counting timeouts. Both printed a percentage on a pricing page. Neither told you which was which.
This is the quiet scandal of Solana transaction landing. Everyone advertises a rate. Almost nobody publishes a method.
So this article does something different. It gives you the measurement protocol first, in enough detail that you can run it yourself against any provider—including us—and only then shows our figures. If you want to know how to improve your landing rate, we have covered that in depth in how to land transactions on Solana and how to improve your Jito bundle landing rate. This piece stays on measurement.
What counts as "landed" in the first place
Before you can measure a rate, you have to fix the finish line. On Solana there are three of them, and the same transaction crosses each at a different moment. If you want the full journey, how a Solana transaction works covers it end to end. Here is the part that decides your number.
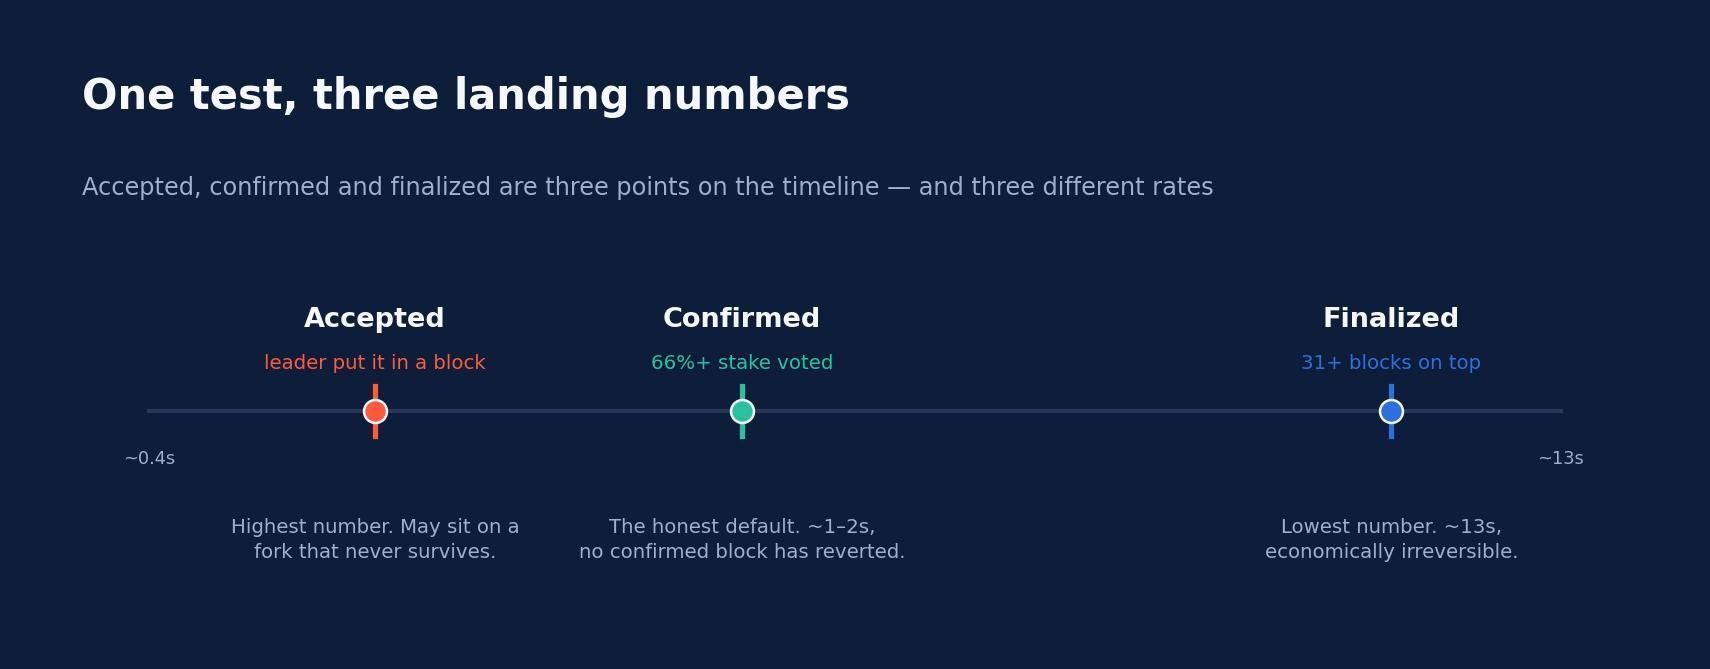
Solana exposes three commitment levels, and they represent progressive certainty about the same transaction.
The gap is not academic. Solana's own confirmation guide notes that roughly 5% of blocks never end up finalized. So an accepted rate can sit five points above a finalized rate for the exact same sends, with zero difference in the underlying infrastructure.
A landing-rate claim that does not name its commitment level is unfalsifiable by construction. That is the first question to ask, and most vendors cannot answer it.
The five things that quietly distort the number
Once the finish line is fixed, five variables can still swing the same measurement by tens of points. If two providers did not hold all five constant, their rates are not comparable—no matter how precise the decimals look.
Priority fee
Landing rate is a function of what you paid. Nozomi's documentation recommends a compute-unit price of at least 1,000,000, or you should expect subpar performance. Test one path at 1M and another at 5,000 and the first will look dramatically better—because you tipped it more, not because it is faster.
An honest comparison fixes the priority fee identically across every path in the run. Fee tuning as a strategy is a separate topic; why Solana transactions get dropped covers the causes behind a failed send.
Time of day and congestion
A test at 3am and a test during a token launch are measurements of two different networks. Congestion is the largest external variable in landing rate, and cherry-picking a calm window is the easiest way to produce an impressive figure without technically lying.
A credible number states when it was measured, and ideally spans both calm and contested conditions.
Observation window
Over 30 minutes, one congestion spike either dominates your average or misses it entirely. Over 24 hours, spikes get smoothed into the mean. Neither window is wrong, but they are different statistics—and a vendor will quote whichever flatters the result.
Dropped attempts
This is the one that turns a mediocre path into a 99% path. If a send errors—a timeout, a rejected submission, a blockhash not found—and you silently remove it from the denominator, you are measuring "landing rate given that the transaction was successfully submitted." That is not what anyone means by landing rate.
Every attempt that left your machine belongs in the sample. Academic work underlines how large this effect is: one analysis of 1.5 billion failed transactions found a 58.43% failure rate among bot transactions. Excluding failures is not a rounding decision, it is the whole result.
Commitment point
It belongs on this list too: counting accepted rather than confirmed inflates every path uniformly before the test even begins. Fix it once at the top of the harness and never change it mid-comparison.
The honest measurement protocol
Here is a protocol you can run today. The design principle is one sentence: change only the path, hold everything else constant, and count every attempt at one commitment level.
The procedure
- Fix the transaction shape. Same instruction set, same compute-unit limit, same priority fee across every path. A simple SOL transfer or a fixed Raydium swap works fine.
- Fix the commitment level. Count at confirmed. Record accepted and finalized alongside if you like, but pick one as the headline and keep it for the whole run.
- Send in parallel. Submit the identical transaction down every path in the same slot window, so all paths meet the same congestion. Sequential testing lets the network change underneath you.
- Sample at least 1,000 sends per path. Small samples are noise. A 200-send test quoted to two decimal places is fiction.
- Log every attempt. Signature, submit timestamp, path, priority fee, slot at submit, slot at confirm, and final state—including failures and timeouts.
- Compute rate as confirmed divided by total attempts. Not confirmed over "successfully submitted." The denominator is everything you tried to send.
What to log
// One row per attempt. The denominator is every row—no filtering.
interface Attempt {
  signature:    string;
  path:         "jito_direct" | "nozomi" | "nextblock" | "lil_jit";
  priorityFee:  number;          // identical across paths in a given run
  submitSlot:   number;          // slot height at send
  submitTime:   number;          // ms, one clock for all paths
  confirmSlot:  number | null;   // null = never confirmed
  state:        "confirmed" | "dropped" | "timeout" | "error";
}

// landingRate(path) = attempts where state === "confirmed"
//                     / ALL attempts for that path
// slotDelay(path)   = median(confirmSlot - submitSlot) over confirmed
Two derived metrics are worth more than the headline rate. Median slot delay tells you how far behind the leader you actually were. The spread between your calm-window and congestion-window rates tells you whether the path degrades gracefully, which is what you are really buying.
Mistakes that produce a beautiful, empty number
- Dropping errored sends from the denominator. Instantly inflates every path.
- Sending paths sequentially, so each meets different congestion. You measured time, not path.
- Different fees per path. You measured your tip schedule, not the infrastructure.
- Counting accepted and reporting it as landed. Up to ~5% of that never finalizes.
- Running the test cold against a path that scores your history. More on that below.
Comparing send paths under one protocol
With the harness above, send paths become directly comparable. These are the routes worth putting in a landing test in 2026.
One detail every honest tester should know: some of these paths score you back. Nozomi applies a quality-of-service penalty based on your landing rate over the last 30 minutes—if only 10% of your recent sends landed, your priority is discounted accordingly.
That is exactly the measurement transparency this article is arguing for, and it has a practical consequence: your own history affects your result. Warm the path before you measure it, or you will benchmark the penalty rather than the path. If you want the mechanics of the Jito route specifically, Jito explained: bundles, tips and MEV covers it.
A note on Beam's routes
Beam by RPC Fast is our specialized transaction-delivery layer. It bypasses standard RPC nodes and routes transactions through high-speed staked networks — Nozomi, Astralane, bloXroute and Falcon —to reach the leader with minimal latency.
So when Astralane or bloXroute comes up in this space, they are not rivals on the test bench. They are routes Beam sends through. Beam's job is to select the fastest live route per transaction, which is why we measure routes rather than argue with them.
Average block delivery through Beam is roughly 330ms against a ~457ms standard-RPC baseline, with no replay lag and consistent same-block inclusion.
Our numbers, same protocol
The whole point of publishing a method is to be measured by it—including where we fail it ourselves. Below are our published figures, the matchup we lose a quarter of the time, and an honest note on where our own numbers do not yet me-et the bar this article just set.
That honesty is the entire value of the exercise. A number you cannot check is worth nothing, and a number that only ever flatters us would be exactly the thing this article spent 2,000 words warning you about.
From the RPC Fast Beam Aperture benchmarks and the May 2026 infrastructure update, measured at confirmed, with sample size and window as stated on those pages.
What we will state without a placeholder, because it follows from architecture rather than from a benchmark: Beam reaches the leader through staked routes, so it inherits stake-weighted quality of service—a validator's right to transmit packets in proportion to its stake. Solana SWQoS and staked connections covers the mechanism in depth.
Under the protocol in this article, that advantage shows up as a smaller gap between submit slot and confirm slot during congestion—which is the thing landing rate is really trying to capture, and the reason a single headline percentage hides more than it reveals.
Quick reference: what to ask about any landing-rate claim
Final thoughts
Landing rate is the most quoted and least defined metric in Solana infrastructure. That combination is not an accident—an undefined metric is a flexible one, and flexibility is useful when you are writing a pricing page.
The fix is not to distrust every number. It is to ask the six questions above, and to run the parallel test yourself when the answer matters. The path that wins under fixed fees, a fixed commitment level, a real sample and full accounting of failures is the path that will win for you in production. Everything else is a screenshot.
We would rather publish the method and be held to it than publish a percentage and hope nobody asks. If you run this protocol against Beam and find a case where we are not the fastest route, that result belongs in the table above just as much as the ones that flatter us.
Want to measure Beam yourself?
A free RPC Fast account gets you a mainnet endpoint with Beam delivery included—enough to run this harness end to end. The free tier is rate-limited at 15 requests per second, so run a few hundred sends to validate the method there, then scale the full 1,000-per-path run on a paid tier. We would rather you tested us than trusted us.
.jpg)


.jpg)


